Add Views and Charts to Forms Using Sub-Grids
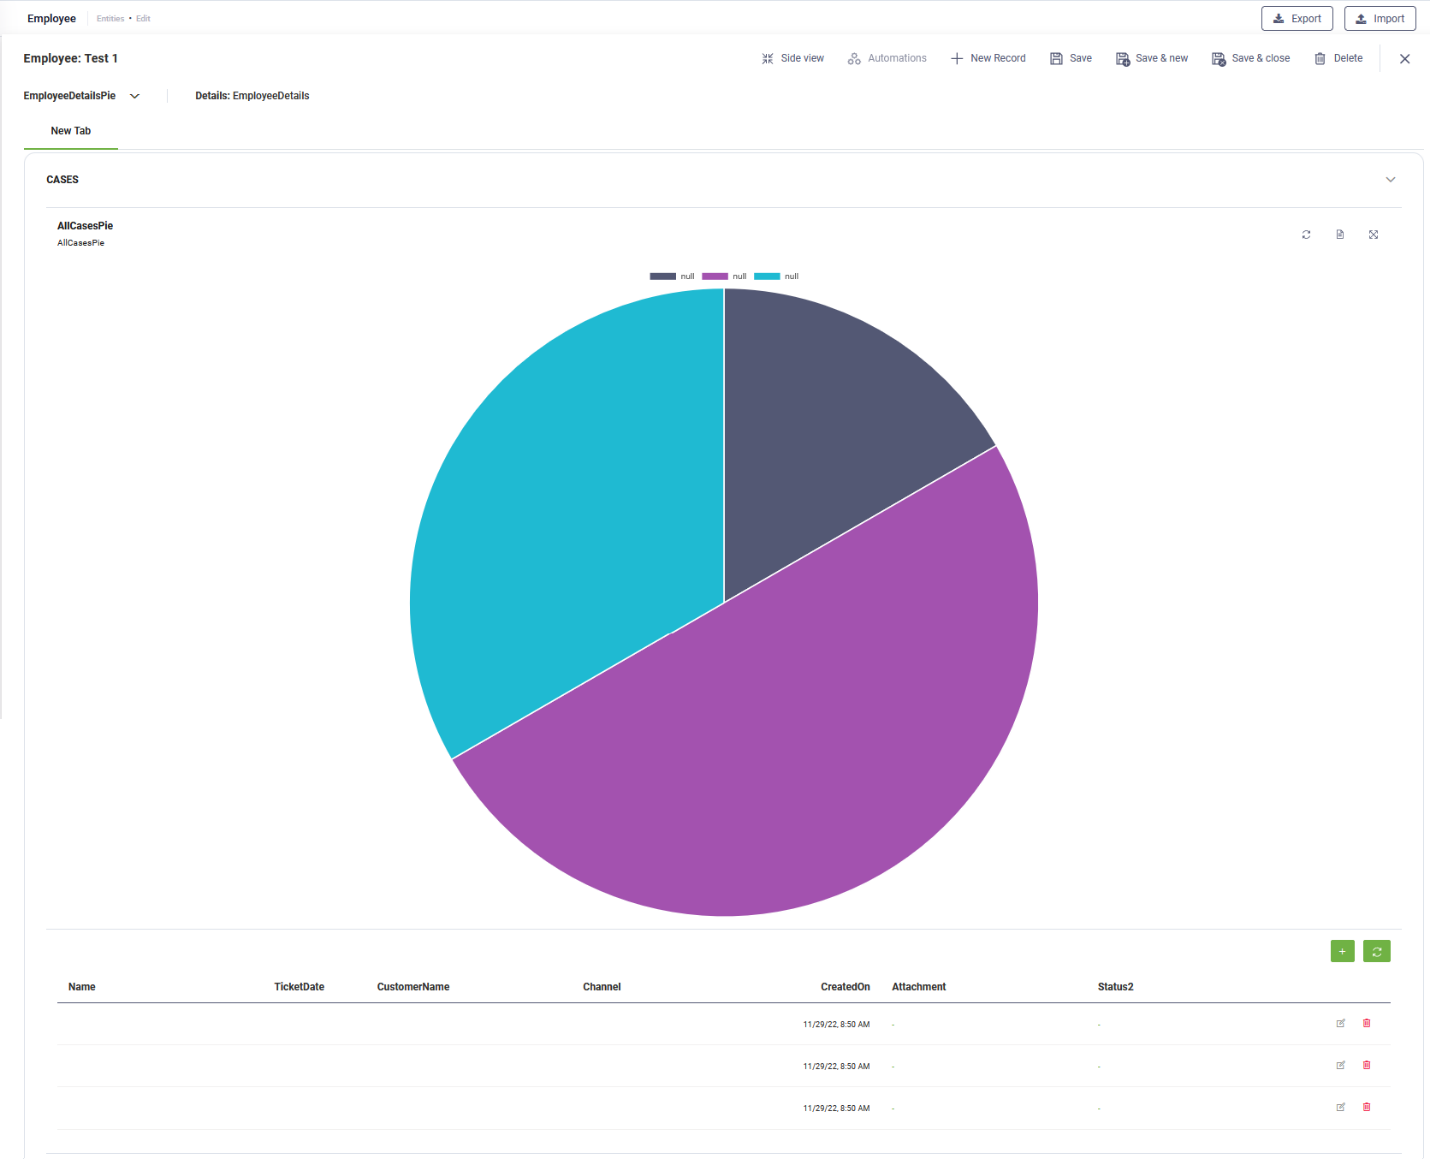
Sub-grids display a list of records on a form as either a table (classic view) or a chart. For example, on an employee form, you can display a list of cases related to that employee and a pie chart showing the number of cases per status.
To add a sub-grid to a form, add an Entity List field and configure it based on your requirements.
Prerequisite
- Before adding sub-grids to a form, define the required views and charts on the entity referenced by the Entity List field. The example below illustrates this setup.
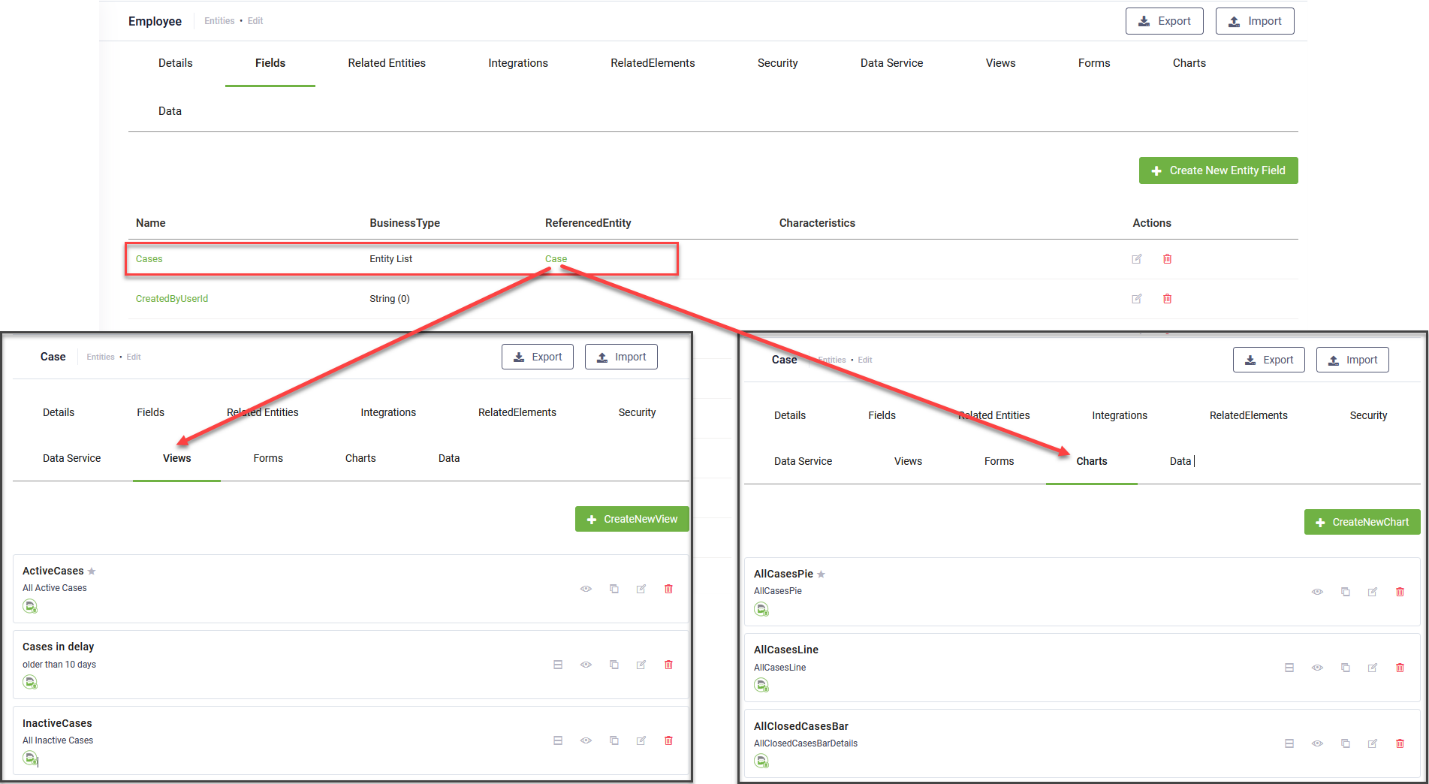
You can display both views and charts for the same list of records.
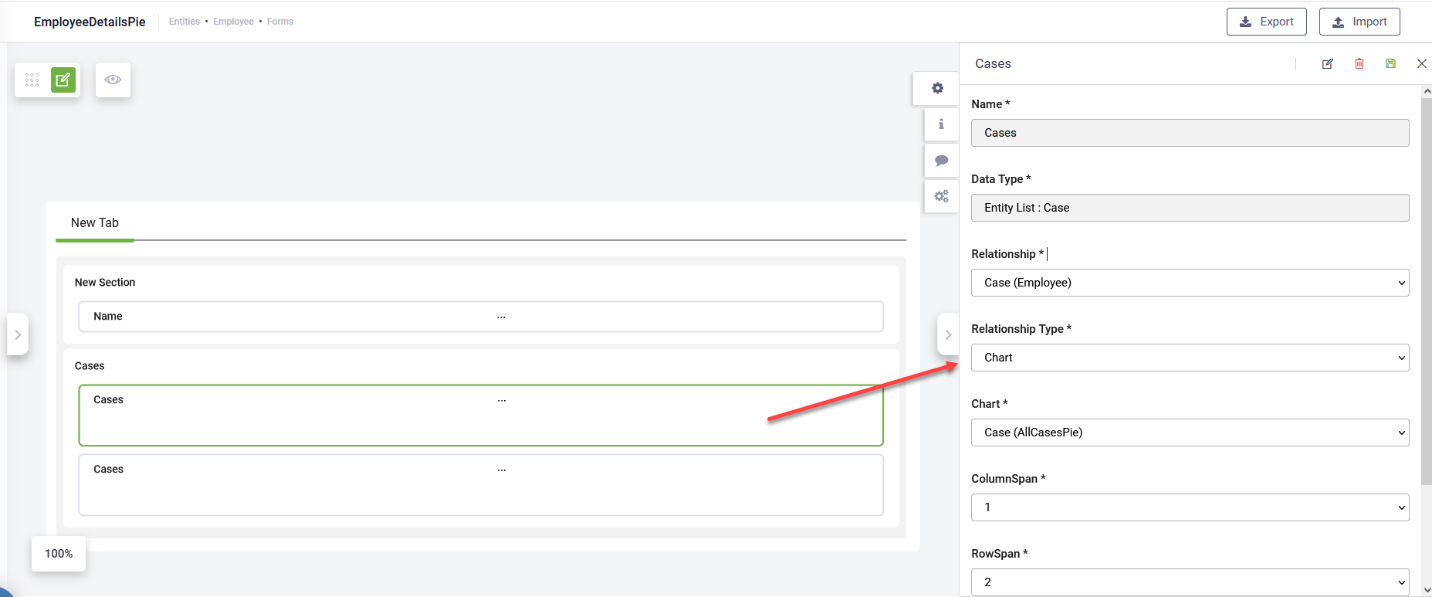
To configure a sub-grid on a form:
- Add an Entity List field to the form.
- Click the field and configure the following settings:
- Save the configuration.
| Field | Description |
|---|---|
|
Relationship |
Select the entity referenced by the current entity list field. |
|
Relationship Type |
Select either View or Chart based on the type of sub grid you want to add on the form. |
|
Chart |
This field displays only if Relationship Type is Chart. Select the chart you want to show on the form. The drop-down lists the charts defined on the entity referenced by the current entity list field. |
|
View |
This field displays only if Relationship Type is View. Select the view you want to show on the form. The drop-down lists the charts defined on the entity referenced by the current entity list field. |
| Column span |
Defines how many columns the field spans (1–3). Default: 1. |
| Row span | Defines how many rows the field spans (1–3). Default: 1. |
|
Read-only |
Prevents users from modifying the data in the sub grid on the form. |
|
Hide on mobile |
Hides the sub grid when users access the form on mobile devices. |